How to use breakout strategy

What is a breakout strategy? How to use breakout strategy?
Breakout is a market situation that presents a good opportunity to take profit forex traders.
If you want to know what is a breakout strategy, what conditions are driving the breakout?
And how to implement this breakout strategy? I think here some explanation will be giving some insight for day trading.
Many professional traders use the breakout trading strategy, and this strategy can be implemented in all types of financial markets, forex, stocks, cryptos, CFDs.
The difficult thing in trading is minimizing losses, in implementing a strategic breakout it is very important to maintain discipline in measuring the risks that might occur because the breakout that occurred may only be a temporary movement.
In practice, there are several ways to trade with a breakout strategy.
For example by using support and resistance, using Bollinger band indicators, taking into account candlestick patterns, etc.
Are you expert to use breakout strategy? Start trade with TenkoFX broker.
Good forex Brokers with positive feedback of reviews from users and are regulated by IFSC BelizeOpen an account or try Demo account.
What is the Breakout strategy?
A breakout is an event when prices break out from the consolidation area or price range where an asset price movement on sideways for some time.
The breakout can also refer to a situation when a certain price level is broken.
Whether it supports, resistance, pivot points, Fibonacci, or other levels depending on perspective trader with their method.
Breakout is contrary to the understanding of normal trading which considers traders should sell at high prices and buy at low prices.
In a Breakout situation, traders recommend to buy above the resistance level and sell below the support level.
trading a Breakout, the trader must enter the market (open a trading position/order) as soon as the price gets a breakout and let the position until the volatility decreases.
Take a look image below
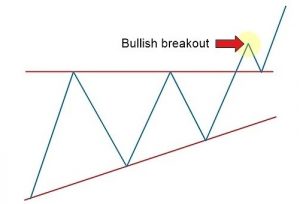
The picture above is an illustration of a breakout in an uptrend.
Traders map support and resistance areas by using horizontal lines, which are zones we can say to zones possibility, strong area to break in a price trend.
The idea is if the area breaks the support or resistance line then it will become a new trend.
An example of the picture above is in a bullish trend with a break in the resistance level.
Typically if the area breaks then it will become a new support or resistance.
Now we take an example for downtrend breakout.
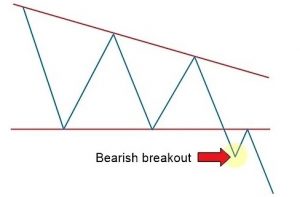
In the image above is in a bearish trend, and a break at the support line occurs.
In theory, the downtrend breakout with the uptrend is the same, namely a break in the crucial zone.
It’s just that on a downtrend, a break occurred at the support line while at an uptrend a break at the resistance.
Important points in the strategy breakout
In how to use breakout strategy there are some important points that concern traders.
- Support
- Resistance
- Breakout
- Retest
The breakout strategy uses support and resistance levels as triggers indicator to confirm a breakout.
If the area retests frequently, the price is difficult to break, meaning that the support and resistance are strong, and the price is likely to bounce back.
But if the area breaks, there are two possibilities, the price will continue the trend, the possibility of both prices will bounce back towards support and resistance.
Daily breakout strategy as aggressive traders will open positions after the breakout, but conservative traders will wait for prices to bounce after the breakout.
Now take a look illustration below.
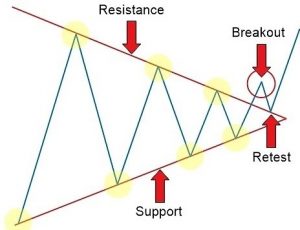
The illustration above has a support and resistance line as a trigger for a breakout, previously several times we saw the price of a line retest support and resistance.
However, buyer and seller pressure began to decline so that it formed a wedge, and finally, the breakout occurred at the resistance line.
Example breakout strategy on the chart
Now we were given an example breakout trading on the chart USDJPY below
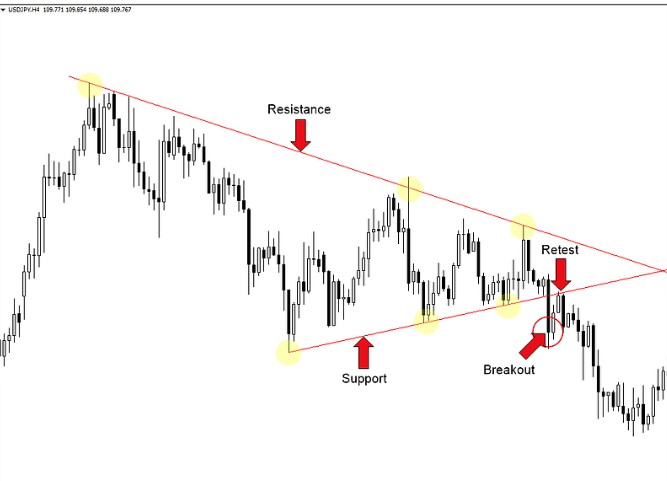
We can see the USDJPY pair pattern above is the same as wedge forming, where this is a triangle.
We use the trendline line to draw support and resistance, and in the end, it will show a decrease in the volume of transactions between buyers and sellers.
So traders must wait for how the price behavior towards the support and resistance lines.
After several retests, the price finally broke out on the support line.
Conservative traders tend to play safe, he will wait for prices to bounce and retest support line for open sell.
However, an aggressive trader will immediately open a position after the breakout has occurred based candle breakout indicator and placed a stop loss on the resistance line.
How to use a breakout strategy to executed order
Some strategies may not use stop loss, but in a strategy breakout, there are three important points that are included in the trading plan.
- Entry point
- Stop loss
- Profit target
Entry point
Breakout strategy uses trigger support and resistance lines, expertise in drawing support, and resistance lines are very important when traders do it manually with candlesticks.
Traders can actually place buy stops and sell stops above the resistance line and below the support line.
The weakness of this technique is that when a false breakout occurs, the price can re-enter the range of the resistance support zone.
Stop loss
Placing a stop-loss is also important to maintain risk in the settings, usually, the trader will place a stop loss on the support and resistance lines, this is just anticipation when a false breakout occurs.
But for strict risk management, a trader can use swing high or swing low near ask price candle.
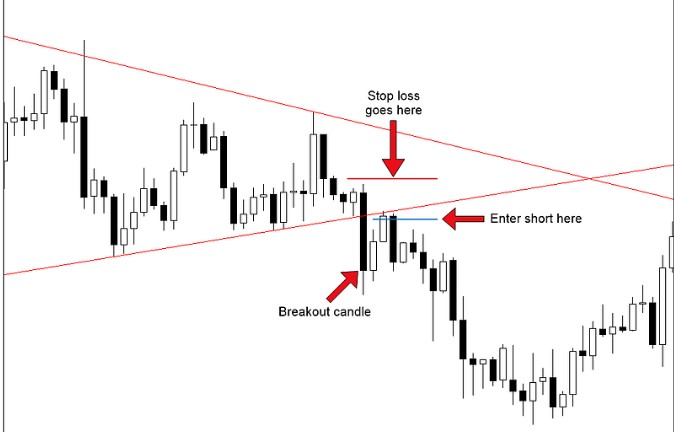
Using lot sizes that are in accordance with the amount of capital and risk ratio should also be a concern, the higher the position size, the more the risk of possible losses.
Target profit
Profit targets are very important in trading plans, too large targets will usually be difficult to achieve if the trend is weak.
Therefore the trader must observe how the trend behavior is strong or weak.
In a strong trend, traders can use a trailing stop or stop loss modification and wait for the trend to start saturating.
When the volume decreases, the price will consolidate and it’s time to set a profit target.
But there are also those who determine profit targets by looking at support and resistance at higher timeframes.
For example, a breakout occurs at H1, then by looking at the daily timeframe, we will get different support and resistance levels.
From the support and resistance lines can be a profit target, but keep in mind that not always the target will be achieved.
So be thankful if you get profit rather than loss even if only a few pips
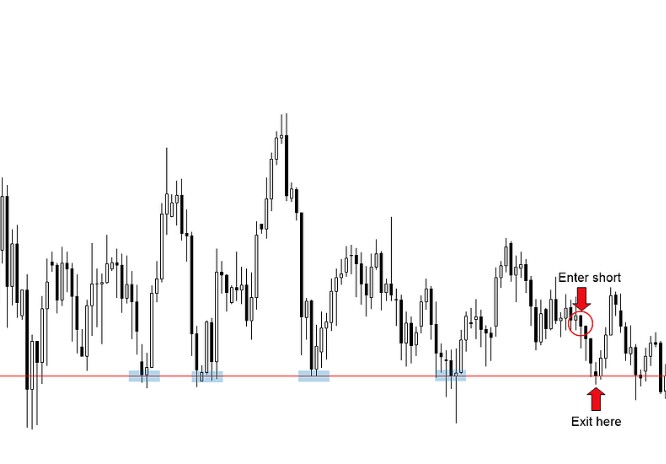
By paying attention to the daily timeframe where support and resistance will be seen from past price history in a few months.
This will help in determining profit targets.
Determining this profit target is optional, some traders prefer to use risk-reward ratios making it easier to calculate the possibility of profit and loss multiplied by the number of orders.
How to use breakout strategy for potential entries
Often the price behavior repeats its own history, the longer the time the price behavior forms a wedge, the higher the likelihood of a long breakout will occur.
This is not always the case, but about 9 out of 10 of these conditions provide potential entries that provide high profits.
Now take a look image below
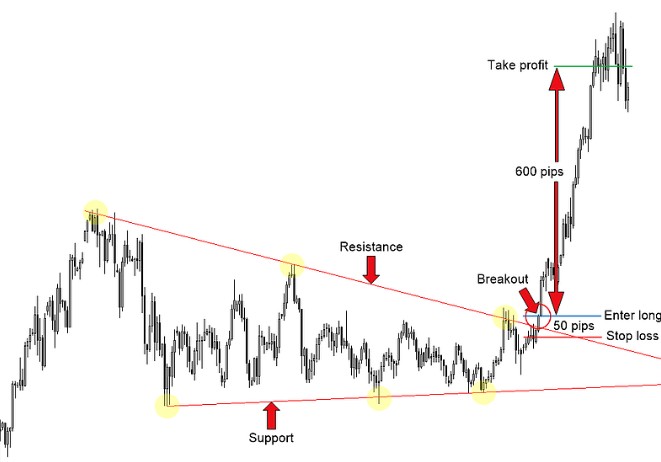
From the image above, we can see that price movement occurs within a wedge range for several months.
But after finally, break out in the resistance line, then prices move sharply to more than 600 pips.to uptrend
Profit potential in this condition is very high, but of course, not all the time will get the momentum of this condition.
This is the importance of understanding the potential breakout strategy so that if at any time meet this condition, traders will be able to seize this opportunity.
But before opening a new entry, you should still use stop-loss as part of risk management.
With a stop loss of 50 pips and a potential profit of up to 600 pips is a good trading setup with minimal risk.
FAQ
1 What is a breakout strategy?
Breakout is a condition where the price of an asset moves outside the level of support or resistance due to an increase in volume.
Breakout allows for increased volatility in the future, large price changes, and, in many circumstances, major price trends.
2. How do you confirm breakouts trading?
The strategy breakout uses important to support and resistance levels as triggers.
After the price breaks the support or resistance level, this is the time to make a new entry.
3. How do you prevent fake breakouts?
To avoid fake breakouts, the way traders do is to wait for the price to bounce before making an entry.
After a breakout, the price may return to the initial track, so waiting for the next candlestick is a way to avoid fake breakouts.
4. How do you do day trade breakouts?
- Avoid price trends that have extreme volatility
- Don’t fade the gap
- Avoid trading in thin assets.
- Trade on price trends that have a fairly large price range.
Conclusion
The breakout strategy is one of the popular trading methods and many traders make use of this strategy
How to use a breakout strategy is quite easy but requires patience in getting potential entries.
Some traders may be impatient if you only use this strategy because potential signals rarely appear.
So they implemented several strategies in their day trading.
This will actually complicate strategy evaluation because profit and loss with different strategies can be confusing.
Open an account or try Demo account.
Related article
What airdrop cryptocurrency means? How it works?
Bitcoin wallet service provider, how to secure?
What is qtum cryptocurrency? Collaboration Bitcoin and ethereum


