
Support and resistance basics

When learning technical analysis, support and resistance basics is one that most traders talk about.
This is due to the importance of understanding the concept of support and resistance basics. Because these levels are often used as a reference in determining new positions or determining profit targets and stop-loss levels.
Support and resistance basics are like a barrier, preventing price, where when the price touches this level it tends to reverse.
The concept seems simple, but in practice, there are various kinds of support and resistance basics. So this area becomes quite complicated to understand.
Best TenkoFX broker. Good forex Brokers with positive feedback of reviews from users and are regulated by IFSC Belize
Open an account or try a Demo account.
Support and resistance basic explained
In short about support, this is the price level during a downtrend where there is a decrease in the volume of demand, which causes the price to hold on to that level.
The support level can be said to be a strong price level where it is difficult for it to break for a further downtrend.
Meanwhile, the resistance level is when the uptrend and supply volume supply begins to decline so that the price is stuck at that level. Because of increasing volume demand.
Often the price consolidates when it reaches this support and resistance point.
When the support and resistance areas have been identified, this can be a reference for traders to create a trading plan.
How do support and resistance work?
The way support and resistance works are like a barrier, when traders trade in theory, buy at low prices, and sell at high prices, this support and resistance can be a reference for these low and high prices.
Resistance is a level that is formed when an uptrend and the price stops rising, then turns back down. Resistance acts as an upper barrier preventing further price increases.
And the way the support level works is an area that is formed when a downtrend price stops falling, then turns back up. The support level becomes a barrier that prevents prices from continuing to fall.
Support becomes the floor price which prevents the price from decreasing further. Meanwhile, resistance like the roof prevents the price from continuing to rise.
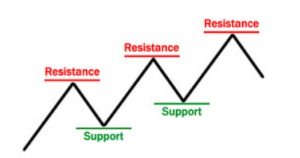
The illustration from the image above reflects the support and resistance that are formed when the price is in an uptrend. Marked by a resistance level that is higher than the previous resistance
Support and resistance basics trendline
Support and resistance areas are levels where the price reverses in the opposite direction, a way to find support and resistance basics can use a trading tool called a trendline.
This is the simplest and easiest way to determine support and resistance. Traders only need to identify the peaks and valleys of price levels from past historical price data. Then drag the peak line to the peaks and valleys to the valleys. It doesn’t have to be right to look for perfection, because this basic support and resistance is basically very dynamic.
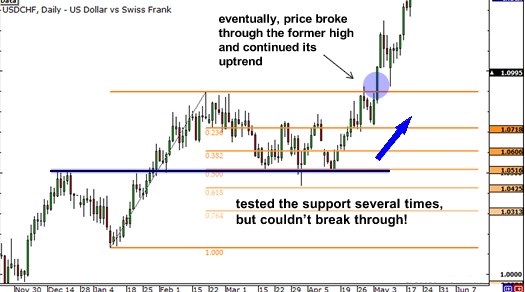
Sometimes the price manages to break the support and resistance but it is only temporary and the price re-enters the previous price range.
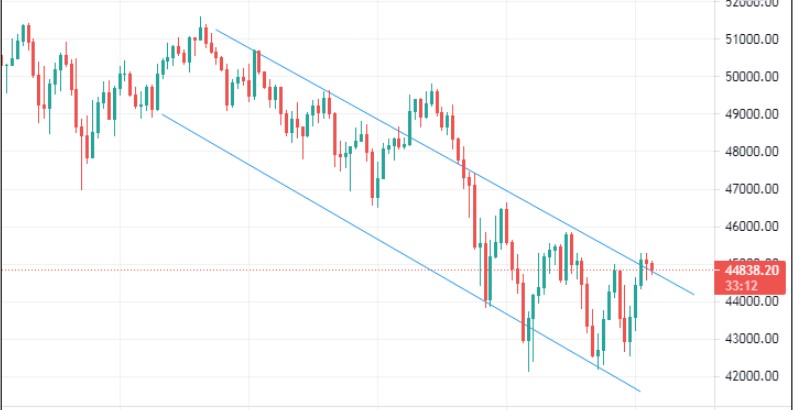
The image above is an example of drawing support and resistance with a trendline. The upper line of the trendline acts as resistance, while the lower line of the trendline acts as support.
However, in practice, the price may be that after the trend line breaks either up or down, it will return to the range, but it can also continue to form a new zone.
When the price breaks and forms a new area, the trendline is no longer valid as a trading reference. It is necessary to draw a new trendline for reference for further market analysis.
Support and resistance round number
Support and resistance theories also exist that use round numbers, this is also considered a psychological level of a price. This is because many traders choose round numbers to buy or sell an asset.
A case in point is that if a person were to buy stock, he would prefer to set the purchase price at say $ 10, rather than at $ 10.06. This round number is also often a concern of traders because it is a price that may have a large volume of transactions.
Maybe in forex analysis, it is very rare for traders to refer to round numbers to determine support and resistance because, in forex, the quoted price of a pair can move in pips which is the smallest unit of price change. But a whole number, such as 1.12000, or 1.15500, can be a number worth paying attention to.
Dynamic support and resistance Moving average
Moving averages are indicators to identify trend direction and trend changes, in general, the use of moving averages if the price is above the MA line means that the trend is in an uptrend. Conversely, if the price is below the MA line, it means that the trend is a downtrend.
However, the MA line can also be used as a reference for dynamic support and resistance areas. Dynamic because it represents a level that is not constant and changes frequently due to changes in historical data.
The setting of the MA period affects the support and resistance levels formed by the MA line. Traders usually use MA 200 for long-term analysis, this provides MA lines acting as support and resistance with good accuracy compared to MA 20 when plotted on the same time frame.
How to read support and resistance moving average
The moving average line acts as a support when the trend tends to go uptrend. All traders understand the concept of price not always moving straight in one direction of the trend.
But it will experience a reversal wave even though it is sometimes only a temporary movement over the correction before continuing its rally on the previous trend.
When the price has gone up high, there is often a rebound, and the MA line can be a level where the price seems to have a barrier preventing the price from breaking the MA line.
The MA line which acts as support can be a reference in determining buy as a level with a high possibility of going up again.
Conversely, the resistance level with the MA line occurs when the trend tends to be a downtrend. When the price starts to bounce and touch the MA line, it can become a strong resistance for the price to bounce back and continue its initial trend.
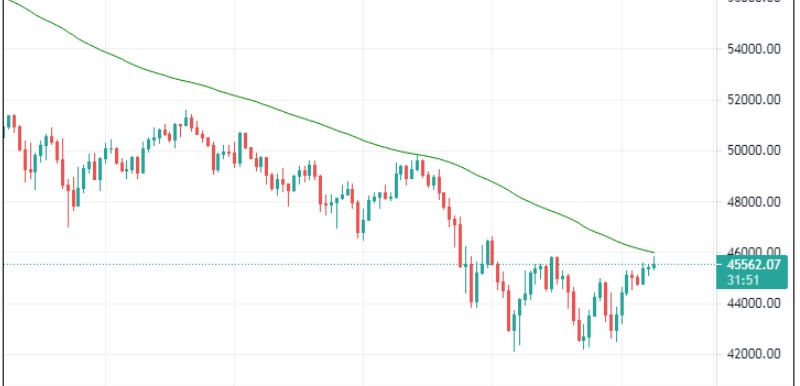
The picture above is an example of using MA200 on BTC/USD which acts as resistance when the major trend is a downtrend. We can see that when the price touches the MA line, it then continues to decline, it becomes a Sell level with a high possibility that the price will continue to down.
Support and resistance basics supply and demand
Basics support and resistance levels can also be obtained through an analytical approach based on supply and demand. How to find support and resistance levels in this way is to find an equilibrium area, where there is a balance between demand and supply.
The equilibrium level that is below becoming a support zone while the equilibrium area that is formed above acts as resistance.
Because the equilibrium area changes frequently, it can be said that the support and resistance with supply and demand is also dynamic, which may be that when the level is invalid, it needs adjustments to the current equilibrium area.
How to identify support and resistance supply demand
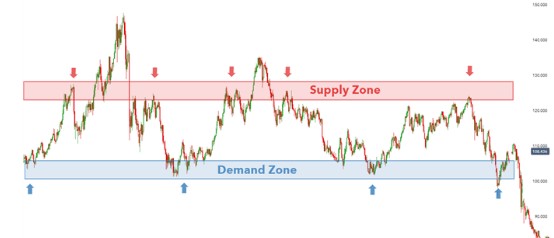
The image above is an example of basics support and resistance which is formed from supply and demand, where the upper area becomes resistant and the lower area becomes the support zone.
When the price approaches these levels there is a high probability that there will be a reversal in the direction of the trend. So that it has the potential to provide profit.
Golden ratio support and resistance basics Fibonacci
Support and resistance basics can also be obtained through a line formed from the Fibonacci golden ratio. Fibonacci retracement lines can act as support and resistance in price movements on assets.
Fibo 50 level is often used as a reference in determining reversal patterns for a trend continuation. For example in a downtrend, if the price bounces and touches the Fibo level 50 line. It provides a high possibility of a reversal and the continuation of the downtrend will be even longer.
Not only the 50 levels, prices often act when touching other Fibo levels. So some traders use the Fibo level to determine to stop loss and profit targets.
The image above is an example of applying support and resistance basics using the Fibonacci retracement. Fibo levels are often difficult to break and a retest occurs before the breakout becomes valid.
Support and resistance basic pivot point
Support and resistance Pivot points are generated from calculations using certain formulas. That produces numbers for Support 1, support 2, and support 3, as well as resistance 1, resistance 2, and resistance 3.
The first, before finding support and resistance values, is to find the pivot point value. Which takes the high low and close price data which is then divided by three.
Resistance value 1 is generated from twice the pivot point minus the low. Resistance 2 is generated from the Pivot point plus the high minus the low. And resistance 3 is generated from the high plus 2 times the pivot point minus the low.
While the value of support 1 is generated from two times the pivot point minus the high. Support 2 from the pivot point minus the high minus the low. Support 3 from two times the low minus the high minus the pivot point.
Manual calculations may be quite complicated and time-consuming. But traders can use a pivot point indicator which will automatically calculate and display on a chart. Another way is to use pivot point calculators available on several forex sites such as babypips.
Support and resistance significant zone
Support and resistance are analogous to ceiling and floor. If in-house the ceiling and floor act as upper and lower limits. Imagine you have a ball, here the ball is an analogy for the price. If the ball hits the ceiling. It will bounce downwards, and vice versa if it touches below it will bounce upwards.
It is a simple analogy but in practice, these supports and resistances have a significant area. Of high validity, if they meet several criteria.
Number touched
The more often the price touches the support and resistance levels. The more valid it becomes because there is a concentration between buyers and sellers.
Previous moves of the price
A sharp increase or decrease will often face challenges so that it will quickly become support and resistance. This is quite different when the increase or decrease is slow and stable. Support and resistance levels can be reaches further in the long term.
Volume at a Specific Price Level
When the price reaches a certain level and there is often high volume. And it will be repeated because traders remember that these levels are support and resistance that traders concentrate on.
Bottom line
The support and resistance basics area is a price level where many traders believe there will be a buying and selling concentration. Which causes the price to have a barrier preventing the price from continuing further.
In theory, when support breaks it will act as new resistance, likewise, if resistance breaks, it will become new support.
It is a classical theory and in its application, it can be very dynamic. Because the volume of demand and supply that affects price changes is cumulative and dynamic.
Ready to start forex and crypto trading Open an account or try a Demo account.
You may interested