
Advanced support and resistance forex

Advanced support and resistance is knowledge in financial markets that discusses the ins and outs of support and resistance.
Basically, the market is formed by the behaviour of the collective accumulation of market participants. These market players make buying and selling currencies which then affect the volume of transactions which results in changes in the price of the currency against other currencies.
In market analysis, market participants have the same belief about support and resistance (SnR), in this zone, the price faces some kind of obstacle to continue a trend. The zones that are considered to be price barriers are known as support and resistance (SnR).
Best TenkoFX broker.
Good forex Brokers with positive feedback of reviews from users and are regulated by IFSC Belize
Open an account or try a Demo account.
Forex support and resistance (SnR) definition
The definition of Support is the price level where the demand (purchasing power) is strong enough to prevent the price from falling even further.
Traders assume that when the price approaches the Support level, the price is considered too low. So that buyers who see this condition will start to enter the market to take buying action.
The definition of Resistance is defined as the price level at which the supply is strong enough to prevent the price from increasing further.
Traders will assume that if the price enters the Resistance level, it means that the price is considered too high and sellers starting to enter the market.
In this scenario, the supply level can outperform then demand, preventing the price from breaking the resistance barrier. Noticed if Support and Resistance level will not last forever.
The price can break out these boundaries when the market sentiment is very strong to continue the price trend. Since Support and Resistance are important levels that were difficult to break previously, a breakout of these limits will trigger a very strong price movement in one direction.
Support and Resistance (SnR) Illustration
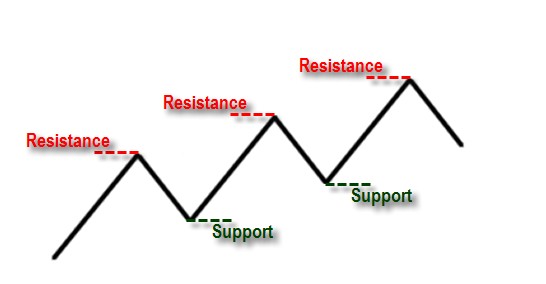
In an uptrend, there is an up and down price pattern which creates the SnR level, in the illustration when the price has found a new high, it will fall to a low which is higher than the previous low.
That level is the support zone, while the high point becomes the resistance zone. If you draw a line from high to high it will be an illustration of the resistance line. and low to low prices will be an illustration of the support line.
Support and resistance zone example
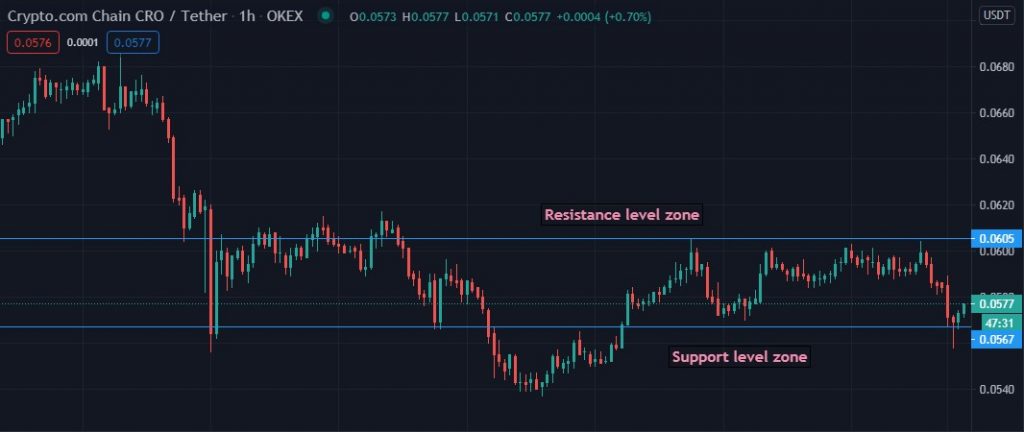
The chart above is an example of mapping support and resistance in the CROUSDT crypto pair. The upper horizontal line becomes the reference resistance zone level, and the lower horizontal line becomes the support zone level reference.
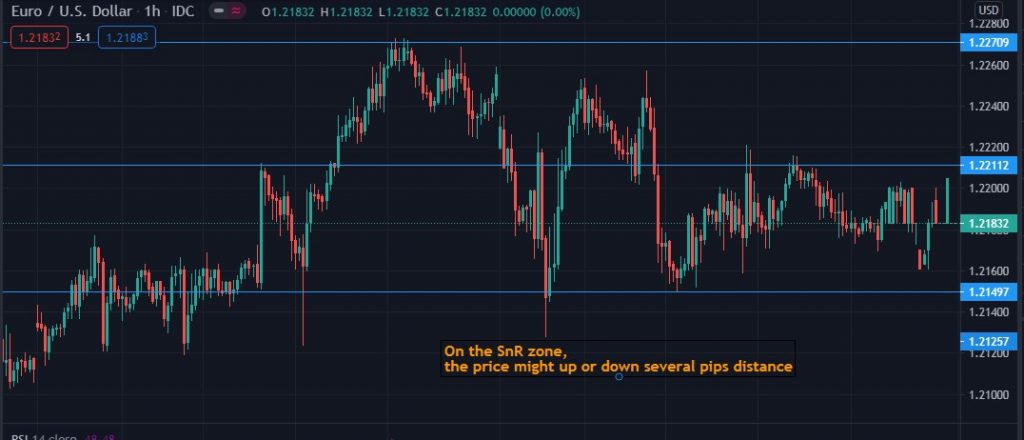
Forex support and resistance (SnR) zones
The so-called support and resistance zone levels are actually not absolute numbers that can be used as guidelines. However, these support and resistance zones are important levels for traders. In theory, the price around the SnR zone will retest frequently, it might be a breakout or reversal.
The more often the SnR level zone retests, it indicates a strong level as a reference for price reversal. However, when there is a breakout at this level, in theory, it will form a new trend.
If there is a breakout, the SnR level will become a new SnR level, say the price is rising and the resistance breakout, then the breakout area will become new support.
The price may go up or down in the key zone, but have not left the key level, it can be said that the SnR zone is still considered valid.
Thus in the SnR zone, the price may move a few pips above or below the key level. It will be useful to set stop loss as part of risk management.
Forex how to draw support and resistance (SnR) lines
Because in looking for support and resistance zones there are various ways either with the help of indicators or drawing them manually.
By using the indicator, it will automatically find the SnR level, for example with the pivot point indicator. Or using the Autofibo indicator, it will draw automatically when the formula calculation is fulfilled.
But if you want to draw manually, you can experiment, draw SnR using the help of horizontal lines or trend lines. Find the swing high and swing low price levels and look back at whether these levels are retest or not.
In a sideways trend, you can use a horizontal line to draw the SnR zone. Meanwhile, in a downward or upward trend, you can use the help of trend lines.
To draw SnR in an uptrend market condition, the method is to find the lowest point of the price and then connect it with the trend line. And find the high to a high point to draw resistance line.
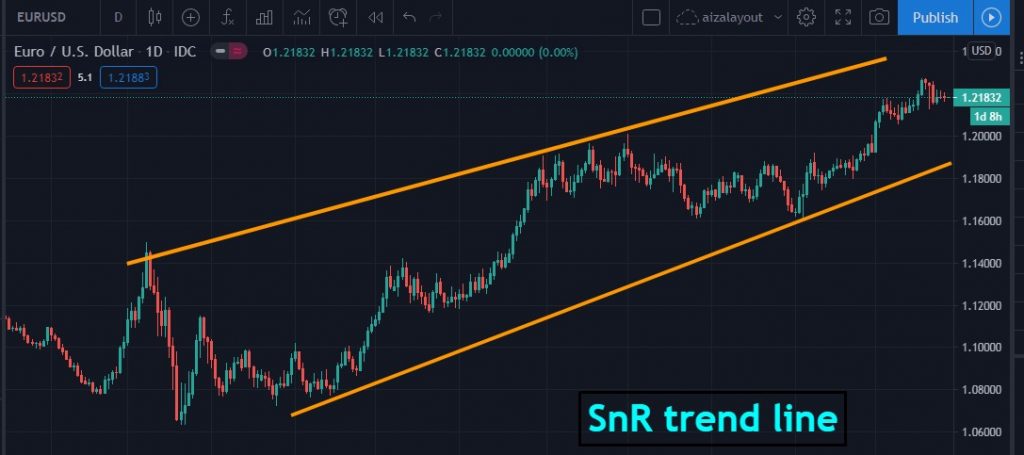
SnR formed from the trend line will be an important key when the price reaches this line. This zone becomes a reference for possible future prices. Maybe there will be a breakout or reversal so that it can be a trigger for a new position.
Forex support and resistance (SnR) levels daily
Support and Resistance (SnR) levels daily can be obtained by utilizing the Pivot point indicator, but you can also calculate them manually using a formula.
SnR level daily formula with pivot point
You can take the previous day’s daily candle data to apply the formula.
Pivot Point (PP) =High + Low + Close
The next step is to calculate Support 1 and Resistance 1.
R1= (2 x PP)-The lowest price
S1 = (2 x PP)-The highest price
R2 = PP+(Highest Price-Lowest Price)
S2 = PP-(Highest price-Lowest price)
R3 = highest price+2(PP-lowest price)
S3 = Lowest price-2(Highest price-PP)
The pivot point level itself can act as the centre line for the trend indicator. Prices above the pivot point indicate an uptrend, below the pivot point indicates a downtrend.
While the S1 and R1 levels are the first zones of SnR, while S2 and R2 are the second zones of SnR. Meanwhile, S3 and R3 are the third zones of SnR.
Forex support and resistance level daily are useful for the day trader. They can use the SnR level to determine the target and stop loss.
Forex support and resistance (SnR) breakout strategy
A strategic breakout is described when the key level SnR is a breakdown by price movements. Ideally, SnR is a strong area that prevents prices from continuing a trend.
However, sometimes the SnR level becomes helpless due to the large transaction strength causing a breakout.
In theory, in case of a breakout, the price will form a new area of the SnR, the price may not return to the previous SnR zone in the near future.
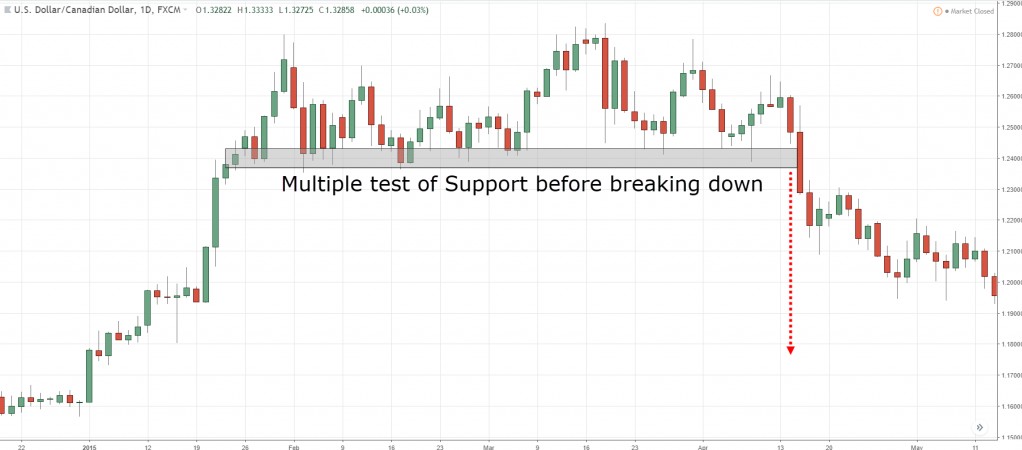
Look at the example chart above. How does the price react when it approaches the support line? In this zone, there have been several retests. Maybe you have thought, the more retest will more strength, but actually not. The support zone becomes weaker and eventually breakout.
Its because no further big institution opens buy after retest area.
The price bounced up after being close at the support zone. However, it turns out that the buyer’s strength is not strong enough to form a bullish trend. Until finally the price returned to the support zone. However, it turns out that the price breaks the support level.
It is a breakout condition, so it is a short signal with a measurable target.
Another example SnR breakout strategy
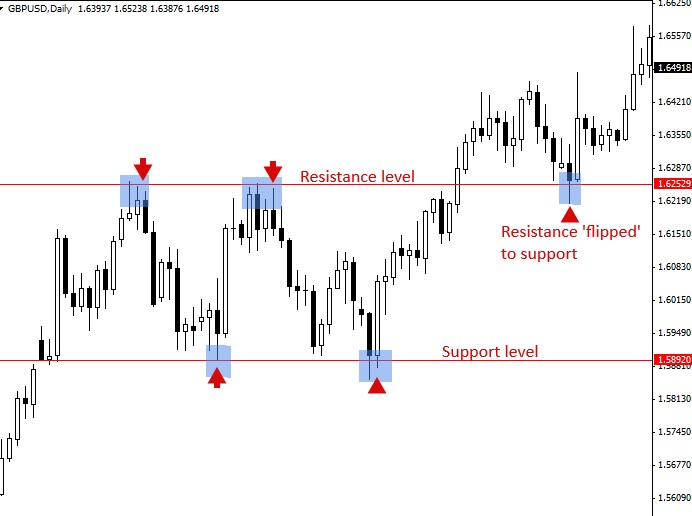
From the chart above we can see, after price success to breakout from resistance level, then price bounce back and the resistance level becomes the new support zone.
So it’s mean if trade based on the breakout, the main point is to determine the best exit point as target profit. Too larger target might not be achieved, so set a reasonable target if you work as a short term position.
The short position usually will take profit from one wave changed. But if working long term trading, stop loss required as risk protection if occurred false breakout.
Next example
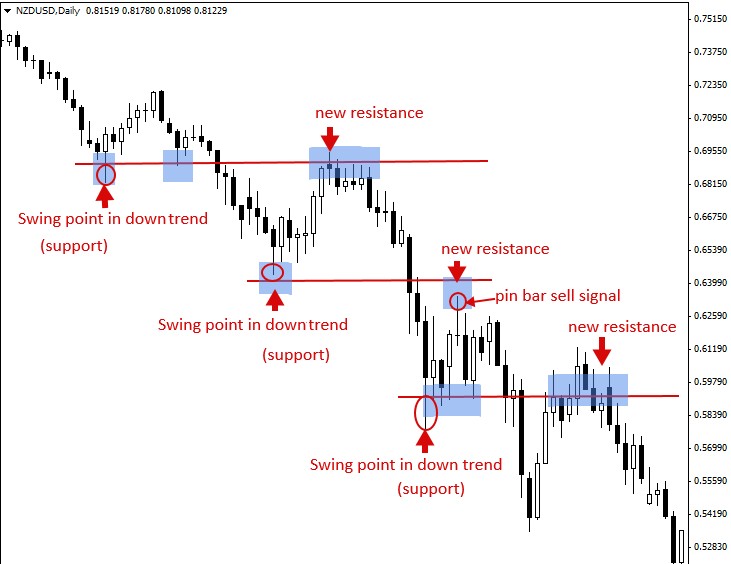
From the chart above we can use support and resistance (SnR) zone as a trigger position. With combine by price action candle like as Pinbar, inside a bar, hammer etc, we can use the level to open a new position.
If trade based on breakout then the conservative trader will be waiting for the next candle after breakout as confirmation signal, but the aggressive trader will immediately open new order after a breakout has occurred.
Fractal breakout forex support and resistance (SnR) strategy
The definition of a rising fractal in forex is simply the bar that has the highest high, flanked by at least two bars of lower highs. Likewise for the down fractal.
Fractals that are formed at the highest or lowest point will be given an arrow according to the direction of movement.
The use of Fractals in trading is to take a position in the direction of the fractal breakout. If the price moves past the upward fractal, the position to take is a buy. Conversely, if the price moves past the falling fractal, the position taken is short.
But not all fractals are a signal. Only the fractal which is preceded by another fractal in the opposite direction can be used as a signal.
There are also fractals of a start type, namely fractals which are the starting point of signal fractals. Or in other words, the fractal is always followed by another fractal in the opposite direction. In use, Fractal start can be used as a stop loss placement.
How to trade fractal breakout
How to use support and resistance breakout fractals by utilizing the SnR zone by using fractals as a confirmation signal when a breakout. Earlier it was explained that a fractal is a bar with the highest high flanked by at least two lower highs.
For simplicity, look at the chart below:
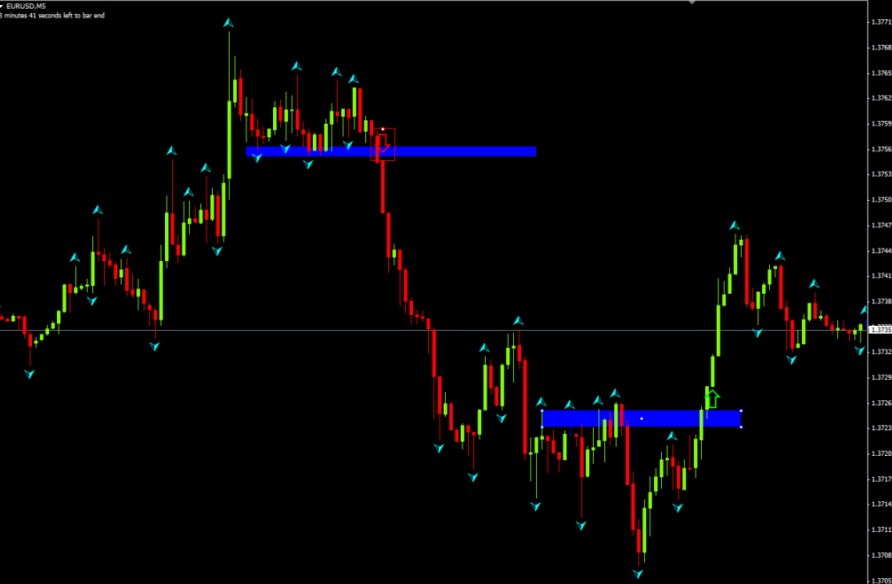
We can draw support and resistance zones by looking at historical prices where there is a tendency to retest.
In the example above we use fractals as support and resistance to find a breakout.
In the example above we get two fractal breakout signals. The first is when the fractal is down, and the second is when the fractal is rising.
A simple way of trading a fractal breakout is when the price crosses the fractal, the trader opens a position by placing a stop loss. The exit point is an important part to get success trading. Beside stop loss to exit you can look when the candle confirmed start to weaken its trend.
The Fractal SnR breakout system can work best when volatility is high with a strong trend. However, it cannot work optimally when conditions are sideways.
Difference between support and resistance (SnR) forex
The basic difference between support and resistance is if the support starts at a lower price and finds a key level that allows the price to bounce back up again.
Meanwhile, resistance starts at an increasing price and meets high prices where at that level there is a possibility that prices will bounce back down again.
Support and resistance levels are more difficult to use as a benchmark, as the dynamics of the price allow them to diverge by a few pips. Therefore traders prefer to call it a support and resistance zone.
Difference support and resistance vs demand and supply
The theory of demand and supply in the forex market is widely studied by traders. In general, the demand area occurs when the price is in a downtrend then forms an equilibrium which is marked by lined candles.
This pattern causes the price to move in a narrow range, so it is called the demand area. The idea is this area is likely the price will rise again after the equilibrium phase ends.
Meanwhile, supply is when an uptrend starts to saturate and the price forms a lined candlestick pattern which becomes an equilibrium area. In theory, the excess supply will reach a saturation point and the price may fall again.
Some traders assume that demand and supply are the same as support and resistance. However, there are also those who argue that support and resistance are fixed levels at certain prices. So it is more difficult to apply as a trading trigger.
While demand and supply are areas marked by conditions of price equilibrium. Which is the price area moving in a narrow range.
Forex pairs that respect support and resistance (SnR)
Basically, all pairs are not easy to predict exactly the price movement. However, some experienced experts may find their own character in each pair.
In a discussion on the Forexfactory forum, someone stated that the pair that was stable and predictable was EUR/USD, AUD/USD, GBP/USD. EUR/GBP, USD /CAD and EUR/JPY.
But I think will good if trader make own research which pair that giving easiness to catch profit. Beside all these pair above still many other pair considered as good pair to trade. GBP/JPY has a higher volatile market but spread higher. USD/JPY has low spread but average daily movement quite low, but sometimes occurs larger movement, news impact often hit on this pair.
Support and Resistance (SnR) actually can apply in all instrument not only in forex but also another market. The most important is trader willing spent the time to practice and learn how to trade based SnR strategy.
Bottom line
The Advanced Support and resistance strategy is a simple trading strategy by exploring the way of trading. Even though it is simple, it is very powerful if traders have been able to learn it well.
After all, forex is a risky trade, and this article is just a study that is not an invitation to invest. Each trader investor bears the risks that may occur which have been disclosed in the risk disclosure of each broker.
Ready to start trading? Open an account or try a Demo account.
Read another article