What is market trend analysis?

For a trader to read the market trend analysis, it is very important to be able to do a long-term strategic roadmap. Reading market trends is not as simple as it seems with a price chart.
Looking at the long-term market trend, we will consider primarily the fundamental analysis which is a reflection of economic conditions in a country.
This sometimes becomes a separate bias for novice traders with some data that may differ so that it becomes confusing in predicting long-term market trends.
Understanding a market trend in forex is different from a market trend in general. In forex, analyzes the trend up or down. Meanwhile, the market trend, in general, is a change in the best-selling products sold on the market. For example, before the advent of smartphones, the use of cell phones became a market trend, but after the emergence of smartphones, the market trend changed. Cellphone buyers are decreasing and many are buying smartphones.
![]() Best TenkoFX broker.
Best TenkoFX broker.
Good forex Brokers with positive feedback of reviews from users and are regulated by IFSC Belize
Open an account or try Demo account.
What is the market trend?
Market Trend Forex is a movement that shows which direction the exchange rate or the price of a currency moves in the forex market, whether it goes up or down.
The price movement is not a straight diagonal line in one direction. The market usually moves in a series of zigzags.
Zigzag movements in a market trend often form a series of successive waves with a fairly clear Peak Level high, a higher peak or higher high, a Valley or low, and a higher valley or higher low.
These highs and lows will determine an ongoing market trend. Meanwhile, these highs and lows move up, down, or sideways. The direction of movement is what will later tell traders about market trends.
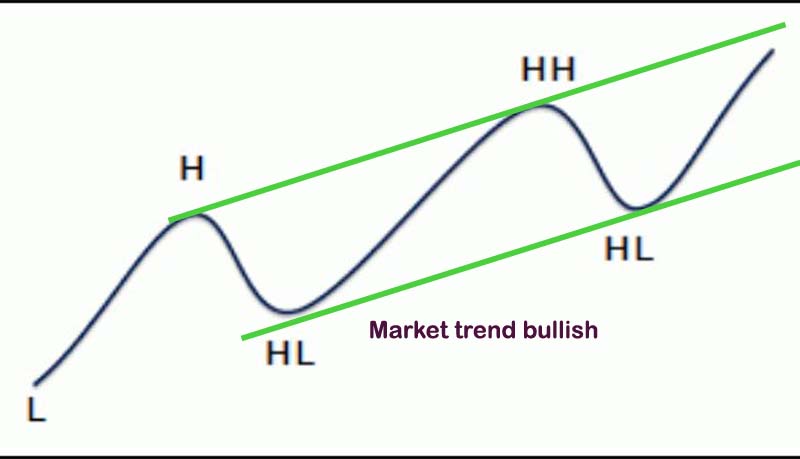
When a market trend tends to go up, it will form higher highs, with higher lows. Market trends do not move straight without waves, but often create patterns with special characteristics, when the market trends tend to be up, down, or flat.
Why the market trend is important?
The market trend is the basis of analysis which is very important for a trader. Maybe you’ve heard the advice, the trend is your friend, don’t fight the trend, ride the trend, etc.
Since a forex trader makes a profit on price changes, if he acts long for profit the price must go up, or he acts short for profit the price must go down.
Therefore, learning how this market trend works is very important for a trader. The mistake in identifying the market trend is the risk of experiencing a loss.
Then in the application, determining when to buy or sell after the trader has carried out a market trend analysis. He will look for a point where the possible risk is low. Because even though the market is trending up, if you open buy at random points, the possibility of being dragged into the price movement can cause it’s own emotions.
So for example in an uptrend in a market, if a trader opens a position when the price is high, it is possible that the price will fall first before continuing the market trend. So that this point allows less maximum profit that will obtain.
What is the market trend tell you?
Market trend analysis will provide predictions about whether the price will be bulls or bears, when the price tends to be bulls most traders will buy, with the hope of gaining profit when the price is higher.
By studying market trend analysis, traders can determine whether the trend is likely to go up, or down, or a reversal. The market trend analysis method may be different for each trader, resulting in different perspectives on the possible future market trends.
However, understanding the concept of this trend is not an easy matter, because the most important thing to get profit is to predict accurately the future market trend. Market trends can occur over a long period of time, and may also occur over a short period.
Understanding the complexity of economic fundamentals may be a reference for long-term market trends, although there can be biases in changing market trends that can easily change.
How do traders identify market trends, some traders use moving averages, some draw trend lines, or use other indicators that function to identify the forex market trend.
How many types of market trends?
The best market trends with the maximum possible profitability are strong long-term trends. Be it bullish or bearish, if the market trend occurs in the long term resulting in a wide change, the maximum profit will be obtained.
While the worst market trend is when the pair has no change in price, or there is a change but it is very narrow so that it does not allow traders to gain profit because the trader’s first loss is being charged a spread fee.
Based on the classification, the market trend is divided into three:
- Uptrend.
- Downtrend.
- Sideways/ flat/ ranging.
Market trends do not move in the same direction it will be dynamic. On it’s way, bullish does not mean a non-stop uptrend, but there will be corrective movement with bearish as a compliment.
Likewise with bearishness, it will always be accompanied by bullish corrective movements during it’s journey. Such movements are a reflection of true market dynamics. It doesn’t only have good times, but also sometimes the market has a hard time where it will fall.
Uptrend market
An uptrend market is a condition in which prices tend to move up gradually. Even though sometimes the price moves down, the decline forms a higher low than the previous low.
If you draw a trend line on an uptrend market, by drawing the low you will get an upward sloping line.
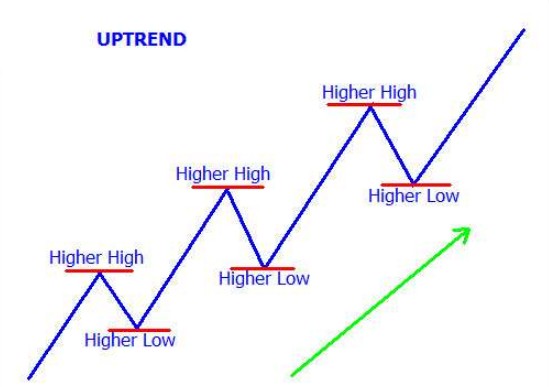
The image above is an illustration of an uptrend market, which forms a low that is higher than the previous low. However, in actual market conditions, it is possible to form irregular patterns so that this illustration only makes it easier to understand the concept of an uptrend market.
Downtrend market
A downtrend market is the opposite of an uptrend market, prices tend to move down and form a high that is lower than the previous high. Traders can draw trend lines to find resistance level during a downtrend so that it can help to find the best entry during a downtrend.
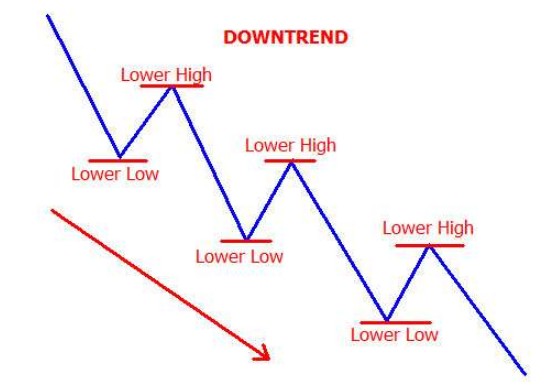
When a market trend is a downtrend, prices do not move down straight, sometimes prices go up as a correction or consolidation before there is a continuation of the trend.
The upper trend line is a resistance level that traders believe is a price limit or barrier that is difficult to break.
Sideways/Ranging/Flat trend market
A sideways trend is a condition where the price tends to form a horizontal pattern if it draws a trend line from high to high and from low to low.
In a sideways trend market, prices often move within a certain range as a support and resistance limit, so this is also called a Ranging trend market, and because of it’s a flat shape, it is also called a flat trend market.
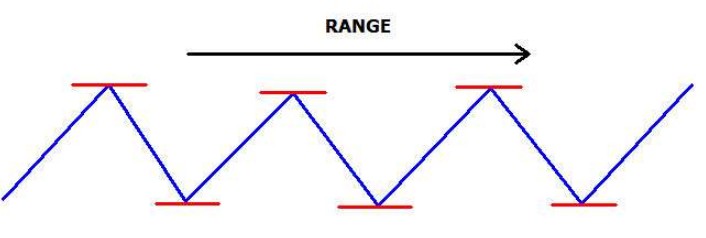
In a sideways market condition or prices move ranging, the way for traders is to wait for prices at support and resistance points to open a position to seize existing opportunities.
How to perform market trend analysis?
There are many methods to perform market trend analysis, an experienced trader can easily see price action and candlestick patterns.
However, some other traders prefer to use technical indicators to identify market trends. Some indicators that can be used for market trend analysis are Moving Average, Bollinger band, Alligator, etc.
Market trend analysis by candlestick pattern
An easy way to identify a trend is to read the candlestick pattern and then draw a trend line to get a picture of the market trend is uptrend or downtrend.
The first step is to choose a reference timeframe, if you are a day trader H1 is easier to accept than the daily timeframe. The next step is to pay attention to price patterns from low to low and from high to high.
When the market is on the uptrend, draw a trend line by drawing from the low to the lowest low. The illustration is in the image below:
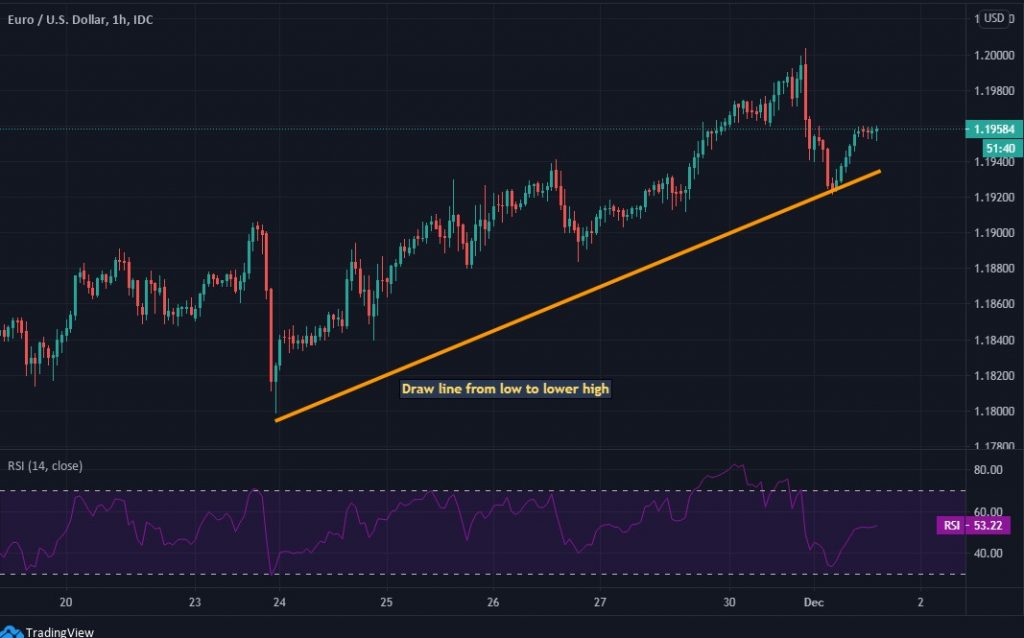
When the market is on the uptrend, the safe way to determine a long position is to wait for the price to approach the trendline, this is often a trader’s dilemma. Patience is tested because most traders are in a hurry to open buy when the price is high, so it is often dragged into the price dynamics.
Waiting for the price at the trend line does not guarantee a definite profit, but this is a lower risk position, with a scenario if the trend line breakout means the trend is likely to change.
Market trend analysis with Moving average
As the name implies, this indicator measures the moving average in the selected period. A simple illustration of how a moving average measures a moving average over a period of 20 means that the formula will calculate data for 20 candlesticks backward.
From the moving average, it becomes the MA line which signals the trend. The price or candlestick above the MA line means the market is in an uptrend, and if the price or candlestick is below the MA line it means it is a downtrend.
To calculate the moving average of a long-term market trend, we can use setting period 200 with sufficient accuracy to identify the market trend.
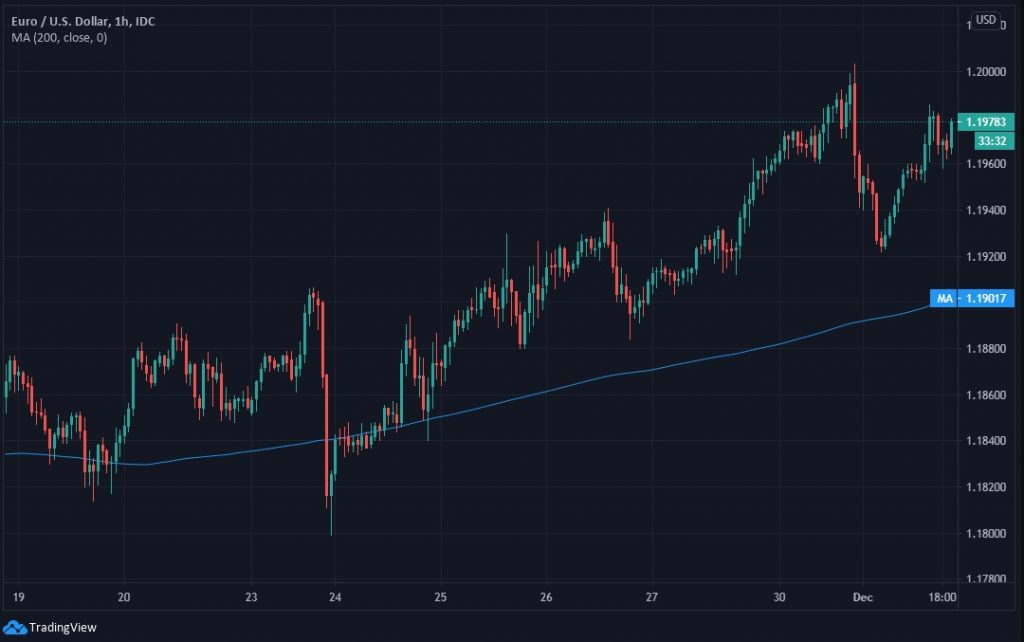
An uptrend can be identified by the rising MA 200 line and the price or candlestick above the MA200 line.
The MA200 line can function as a support zone, while how to determine entry points, traders still need additional tools, for example by combining MA 20 with MA 5 by looking for intersections between MAs as a confirmation signal.
Market trend analysis with Bollinger band
The centerline of the Bollinger bands is the moving average line, while the upper and lower bands are the deviation from the indicator calculation. The higher the deviation setting, the wider the upper and lower band lines.
Basically, Bollinger bands function to measure volatility, but traders can use it to identify rising or falling trends. The trick is to look at price breaks in both the upper and lower bands, if after the break the candlestick closes with prices outside the line, it means that an uptrend or downtrend is in progress.
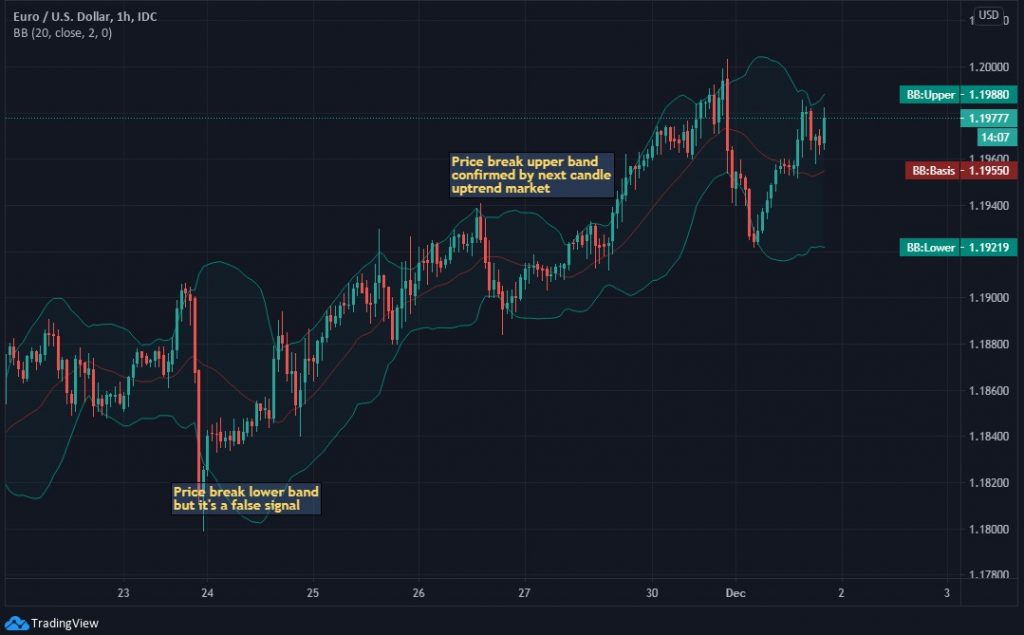
Using Bollinger bands to perform market trend analysis sometimes gives false signals, you need to be disciplined in maintaining risk management to protect against bias signal errors that may arise.
How to calculate market trend?
To measure trend strength is to pay attention to how the patterns are formed by market mechanisms.
In simple theory, if the price retests repeatedly, it is a strong key level. However, this theory is not completely correct, traders should also pay attention to how the pattern is formed.
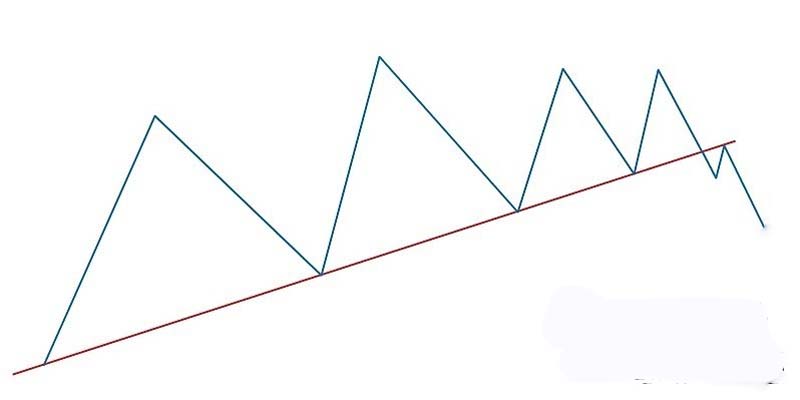
The illustration in the image above is a condition where the trend line has retested several times. The first wave is a retest of a longer period, and the next wave is a retest of a shorter period.
This means that multiple retests allow that eventually there will be a breakout. We see the shorter the swing high wave at the end of the wave, which means that the strength of demand has started to weaken.
If there is a shortening of the wave cluster, it indicates that demand is starting to weaken, and it is possible that the supply will increase causing a breakout from the line that has been retested several times.
How to predict the market trend?
Traders use various methods to predict future market trends, some use indicators and some rely on their understanding of price action. Which method is easiest, sometimes depending on the habit of analyzing market trends.
The way that can be developed is to recognize when the trend will change from rising to falling, and vice versa, and when the trend will stop or weaken.
If you conclude that the market trend is an uptrend, a simple way to predict the timing of the reversal is to pay attention to the swing high and swing low that occurs. This analysis method is very simple but good enough if the trader has a good experience.
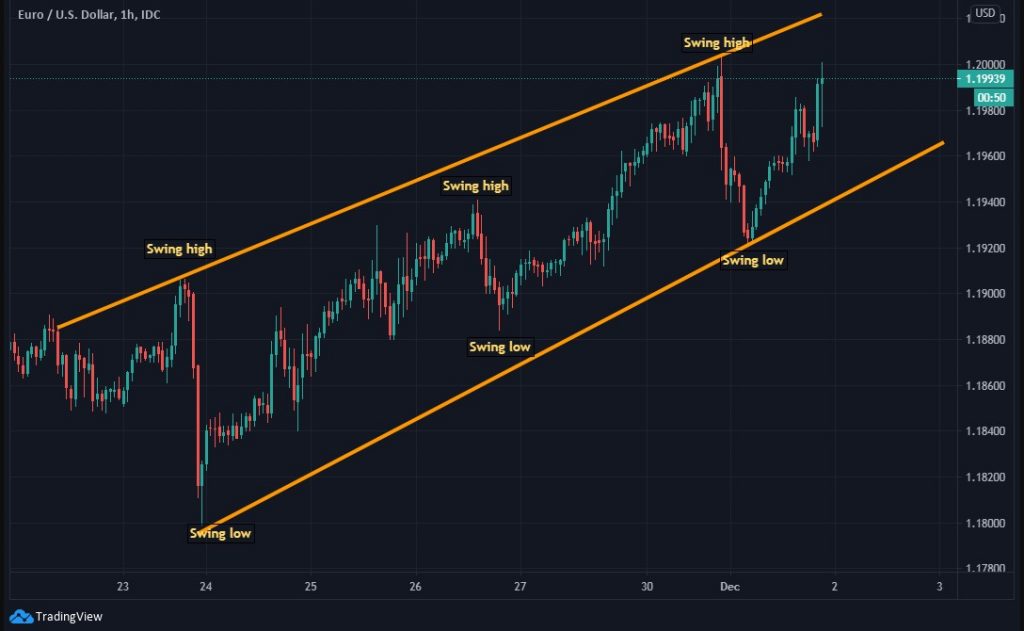
The method above is very simple by finding swing highs and swing lows as a reference in determining long or short positions. You may need to prepare to stop losses to protect when market forces change drastically.
How to know the market trend before opening?
It may be difficult to predict the market trend before the market opens for forex analysis. This is more likely to be applied to the stock market, by looking at previous data and paying attention to company news.
The price trend on the previous day represents how the trend is formed, which may be a continuation of the trend today. The news factor is very important to pay attention to for forex trend analysis because it can cause drastic changes if the news becomes high impact news.
Final thought
A trader must study the market trend analysis because it does not get a profit if the trader goes against the trend. Make a trend as your friend, drive a trend to get profit.
Take advantage of even simple methods to make it easier, because of the confusion because of the complexity, only confusing the analysis. Profit and loss are part of the trade, getting as much profit as possible instead of the loss.
Ready to start trading?
Open an account or try Demo account.
Read more article