Best forex leading indicators

Best forex leading indicators, are several types of MT4 indicators that can help you forex traders, both beginners and experienced in the forex industry.
Leading indicators are indicators that provide trading signals before a new trend starts, that understanding is based on Babypips in the forex education class. Another definition is the leading indicator is a technical analysis that takes previous data to predict future trends.
The leading indicator character is a signal appearing earlier before the real trend occurs. However, no indicators are 100% accurate. Leading indicators also have weaknesses, the appearance of false signals.
Unlike the lagging indicator that gives a signal after the new trend is formed. So you might be a bit late to get the best price when using lagging indicators. But lagging indicators are actually the easiest indicators for beginners, who have a character as a trend following indicators.
One of the most popular lagging indicators is the moving average (Or a better version is Mcginley dynamic indicator, to track trends with EMA 21 and EMA 42 settings), then the Bollinger band. BB actually also uses the moving average in the middle band. Another lagging indicator is MACD.
However, I will not teach about lagging indicators for now. But we will focus on leading indicators that allow us to give earlier signals.
Best TenkoFX broker.
Good forex Brokers with positive feedback of reviews from users and are regulated by IFSC BelizeOpen an account or try Demo account.
What is the leading indicator?
A few short sentences in my introduction have mentioned that leading indicators give signals before a new trend is formed. The advantage of using a leading indicator is to get a signal earlier so that the profit will be maximized. After a signal appears with some support from the candlestick pattern, a trader can quickly open a new position.
Although this type of leading indicator gives a signal at the beginning, it does not mean traders leave without using risk management and money management. Both are the most crucial things in forex trading as a shield to survive.
Example leading indicator
Basically there are many kinds of forex indicators, but the most popular leading indicators in MT4 and third party designs are as follows. Here is the forex indicators list
- Stochastic oscillator.
- Relative Strenght Index (RSI).
- William percent range (%R).
- Commodity channel index (CCI)
- Moving Average Convergence Divergence (MACD)
- Moving Average of Oscillator (OSMA)
- Fibonacci retracement.
- Donchian channel.
Those are all leading type indicators that you can use in trading. Create by an expert as best trading indicators. Although there are many different types of leading indicators. in practice, you don’t have to use them all. Simply take one or a combination of two indicators.
You can monitor changes in indicators and behavior, on one indicator compares with the next indicator so that you can draw conclusions.
Stochastic oscillator leading indicator
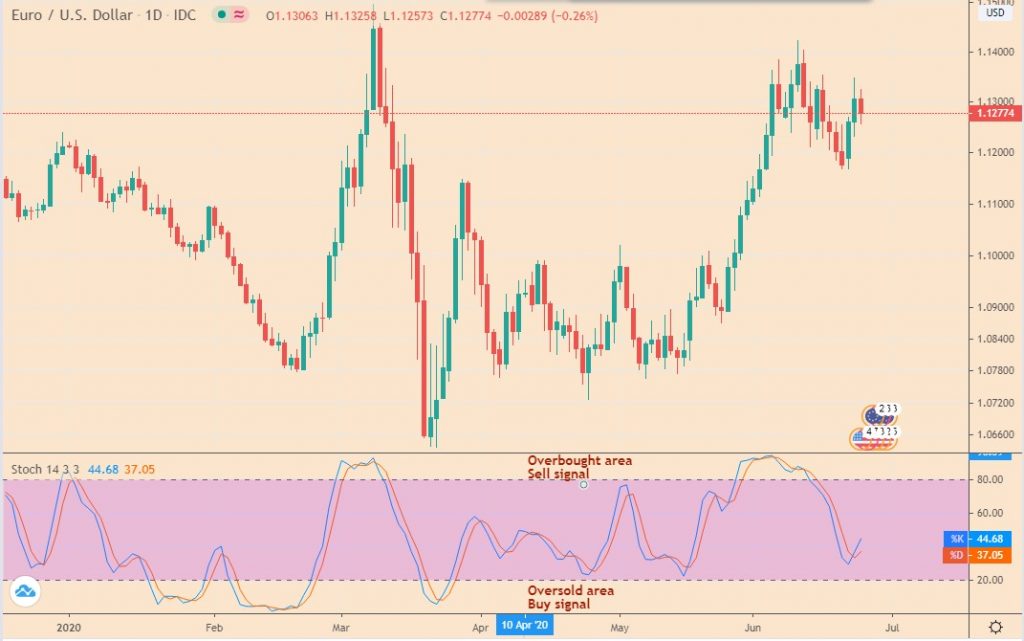
The First Best forex leading indicators Stochastic is a popular indicator and on some trading platforms, there is definitely an embedded indicator. MT4, MT5, Web trader, cTrader, and others. The person who discovered this indicator was George C. Lane.
This is a leading indicator Oscillator that is useful for measuring momentum, including one of the best trend reversal indicators. Stochastic will give a signal when the price has reached the Overbought and Oversold levels. It’s giving more signals instead of RSI, so this included best technical indicators for day trading.
Even this indicator is very easy to use, all it takes is a trader waiting for the stochastic indicator line to enter above level 80 for overbought and below level 20 for oversold.
How to trade? really easy, Buy when the stochastic is in the oversold area, and vice versa Sell when the stochastic is in the overbought area.
Indicator setting
The default settings 5,3,3 can be used on this indicator. But if you try to change the setting with a higher number let say 12,5,5 it will give a different signal sensitivity, but allow it to get signals less often.
That can prevent over trading by lowering the total signal that appears.
Time frame
The timeframe is an important thing that should be a concern of traders. A low timeframe allows more traders to get new signals but also allows for finding more false signals.
But if your goal is to try to trade short-term, with stochastic still possible as a trigger, but stay alert to risk. You should Immediately exit if price action continues the trend.
Using the stochastic leading indicator it is recommended to choose the daily timeframe option, this will provide better signaling with a higher level of accuracy for long-term trading. But besides paying attention to indicators, also pay attention to the key support and resistance zones.
These zones also become a leading indicator. How to see? simple by looking at the history of peaks and valleys in the daily timeframe. Usually, at these key levels, the price will be difficult to break.
Relative Strenght Index (RSI) leading indicator
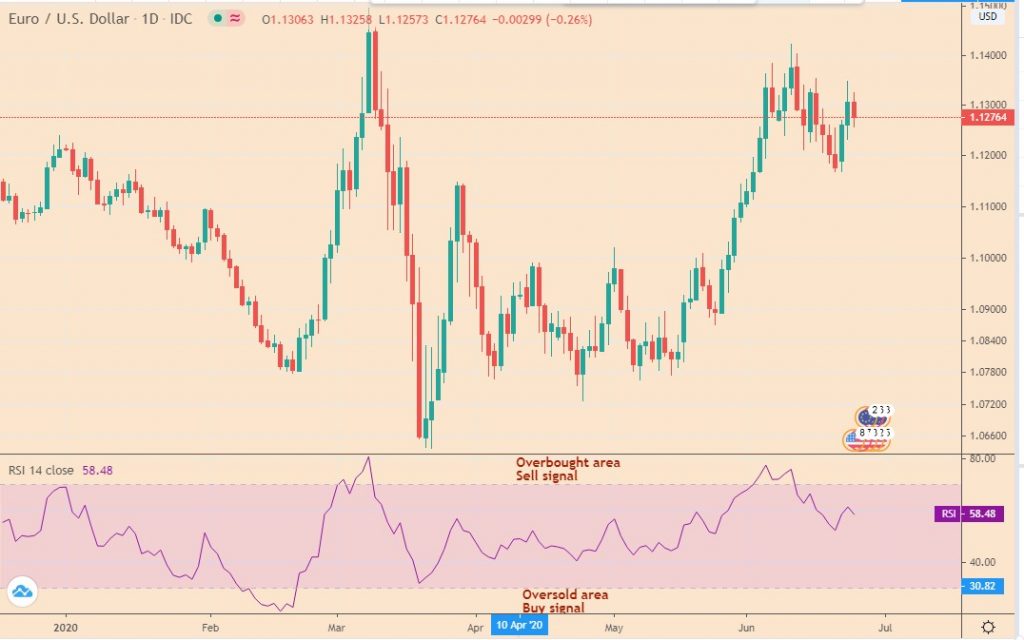
The next Best forex leading indicators is RSI. The picture above is the EURUSD pair, the same as the previous picture, but this one is embedded with the RSI indicator. This design indicator from J. Welles Wilder is very popular, all traders certainly know it.
RSI is also one of the leading indicators, same as stochastic, it’s just that the signaling given by RSI tends to be smoother compared to Stochastic. Signals generated by RSI appear less frequently than stochastic when applied to the same timeframe.
The key of the RSI indicator is at level 70 as an overbought zone and level 30 is an oversold zone.
How to trade? It’s the same as using stochastic, you have to wait for the RSI line to be above or below the overbought and or oversold levels.
If the price has entered the key zone, then pay attention to price behavior and candle patterns that are formed. If there is no sign of a trend reversal, you should wait, even though the RSI has entered the overbought or oversold zone. This is to minimize false signals.
Indicator setting
By default, the RSI setting is considered to be quite good in giving trade signals. The default setting is 14, but you may try to modify the settings with higher or lower numbers.
The higher the setting, the smoother the signal is produced.
Time frame
The actual timeframe selection depends on the trader style, where scalping traders prefer M5 or M15 timeframes, while intraday prefer H1 or H4, and swing traders choose daily timeframes at least.
However, this RSI does not seem suitable for scalping trading, it will rarely trigger a signal. While scalping is HFT or high-frequency trading, it will choose indicators with more frequent signaling.
The RSI has included the best technical indicators for swing trading. This indicator far more suitable for long term or swing trading positions, this will give a rarer signal, and make traders more efficient on margin by waiting for an order trigger signal. Then wait for some time so that the target is reached.
William percent range (%R) leading indicator

Larry Williams is someone who is behind the making of the William Percent Range indicator. Just like his name. This indicator is one of the best leading indicators which is quite popular which is also the best momentum indicator behind Best forex leading indicators.
This indicator is actually similar to stochastic, it’s just different in its scale. The stochastic scale is 0 to +100, while William% R has a scale of 0 to -100, just the opposite of both.
How does the% R indicator work? Just like the stochastic or RSI indicator, it functions more to look for overbought and oversold zones through applied equations.
For overbought areas on a scale above -20, while oversold on a scale of -80. This is just the opposite of stochastic, which is for an oversold scale of 20 and an overbought scale of 80.
How to trade William %R? Like most other leading indicators, this is just looking and waiting for a signal where the% R line is in the overbought or oversold zone. Buy if% R is below the -80 level, and Sell if% R is above the -20 level.
The weakness of this indicator is without a smoother, so the signal will appear more often and allow it to be a false signal.
Indicator setting
By default this% R indicator uses a period of 14, this is the default setting, maybe you want to try other settings, you can try it.
Time frame
Uniquely this indicator is also good for all timeframes, scalping traders can apply this to the M5 timeframe, and swing traders can apply this to daily timeframes.
In the M5 timeframe when movement in the H1 range gives a signal with good accuracy, but you must pay attention to market and news sessions. There are often price spikes when news and market session changes.
Commodity channel index (CCI) leading indicator
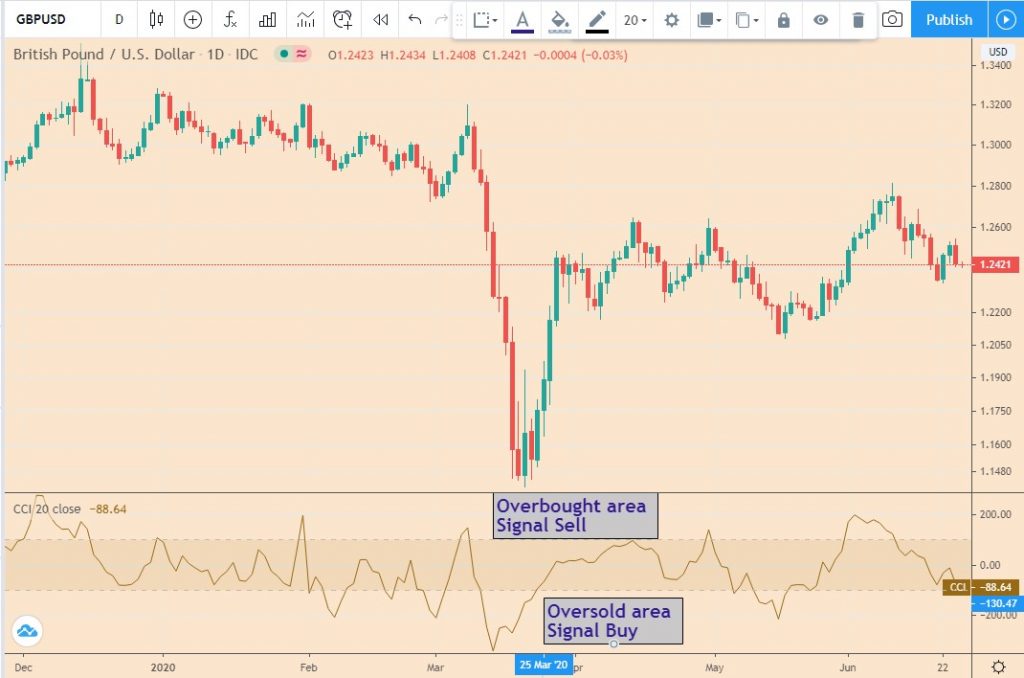
The next Best forex leading indicators is CCI. At first, Donald Lambert designed the CCI indicator for commodity trading. But in its development many forex traders who use the power of this indicator. CCI has three components, similar to other oscillator indicators:
- CCI line.
- Overbought zone.
- Oversold zone.
CCI line on this indicator can serve to shows the current trend, when the CCI line is up, the trend tends to bullish, on the contrary, if it down, the trend tends to be bearish. CCI indicators also include professional forex indicators.
While the overbought area is indicated by a level above 100, while the oversold zone is below the -100 level.
Basically this indicator can also be used to find convergence and divergence signals. But if you want to prevent over-trading. Then it’s better to follow one parameter in making an entry.
How to trade? You can open Buy when the CCI is below the -100 level and Sell if the CCI is above the 100 level. However, this indicator will be better by combining with price action price patterns, so that it will be the best combination of technical indicators.
Indicator setting
The default setting of this indicator is to take a period of 14. If you choose a higher period for example 20 it will take data 20 candlesticks backward so that the CCI line becomes smoother.
You can experiment to find the settings that best suit your needs.
Time frame
The CCI indicator is mostly used for best technical indicators for swing trading using H4 or daily timeframes. Of course, if you use the H4 timeframe, it will show an earlier signal compared to the daily timeframe. This is because data taken in the same period on H4 gives earlier data as a whole.
Moving Average Convergence Divergence (MACD)
Gerald Appel has created a multifunctional indicator called MACD or Moving Average Convergence Divergence. The function that can be taken by this indicator is to measure the strength of the current trend. Determine open positions when to buy and when to sell. Measure market momentum. Knowing the condition of overbought or oversold.
It is true that this indicator is multifunctional, but will you use all the functions for your trade reference or only choose one function as a trading reference.
If I prefer to use one function, it will be much easier to conduct an evaluation, and can also reduce the impact of over trading by generating more signals. In this case, I use MACD for overbought and oversold.
How to using MACD for overbought and oversold cannot also rely on indicators alone, requiring a combination of price action and resistance support so that it can be a filter to minimize false signals.
Indicator setting
Gerald Appel created this indicator by recommending setting the EMA 12, and 26 and SMA 9 standards. This setting is quite good in helping determine analysis and finding signals through this MACD indicator.
Time frame
Basically this indicator can be used on all timeframes, but this will depend on the trader’s style. Swing traders will choose at least an H4 timeframe or even a daily timeframe.
If you are an aggressive trader, choose the M5 timeframe. And if you prefer to trade casually and comfortably choose swing trading then the H4 or daily timeframe is good as the trigger.
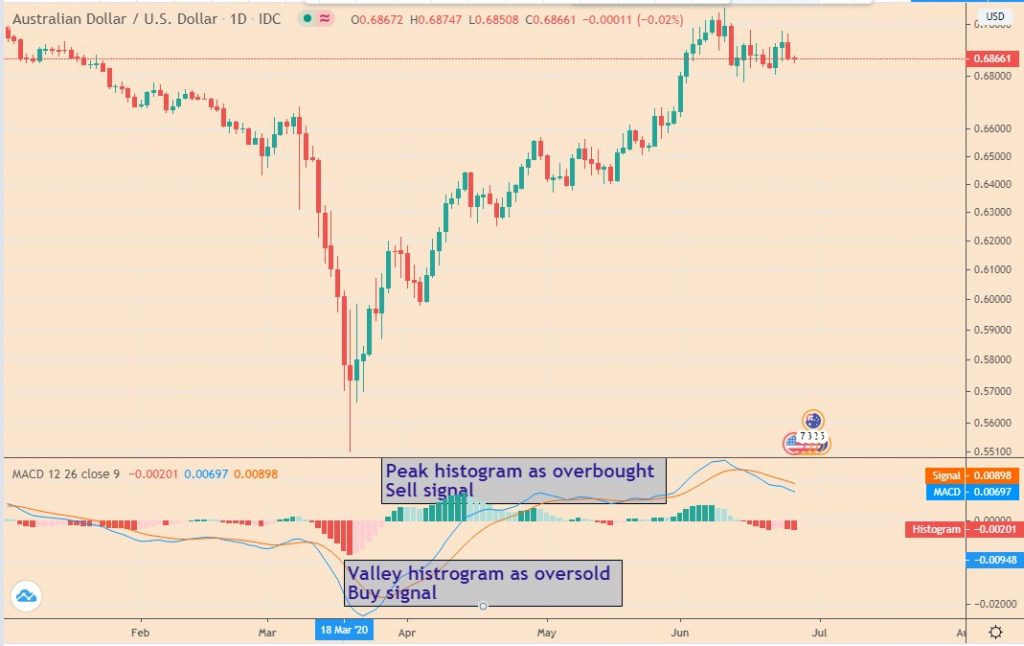
Moving Average of Oscillator (OSMA)
 Osma or moving average oscillator is basically the same as the MACD indicator, but what is displayed in the graph is just a histogram line. Then this indicator uses the histogram line to reference determining the new position.
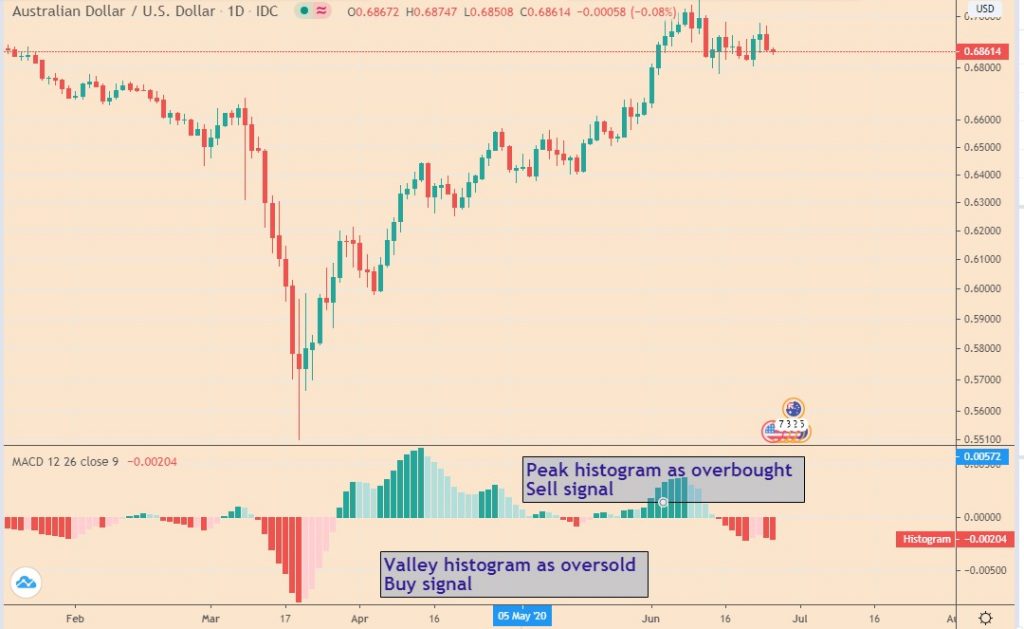
The crossing zero lines as a reference to the change of trend from bullish to bearish and vice versa. If the histogram shows a positive level then it indicates a bullish trend, and if the histogram shows a negative level then it is a bearish signal.
You can use the zero line crossing and the histogram as a buy or sell reference. But Osma was also able to determine overbought and oversold by looking at the peaks and valleys of the histogram.
Indicator setting
Best forex leading indicators Osma settings are the same as MACD, it uses EMA 12 and 26 and SMA 9.
Time frame
Depends on your needs. Because basically this indicator can be used on all timeframes. If you are scalping using M5 it will give more signals to appear from this indicator. But for swing trading, this is the leading forex indicator that is suitable when using daily timeframes.
Fibonacci Retracement
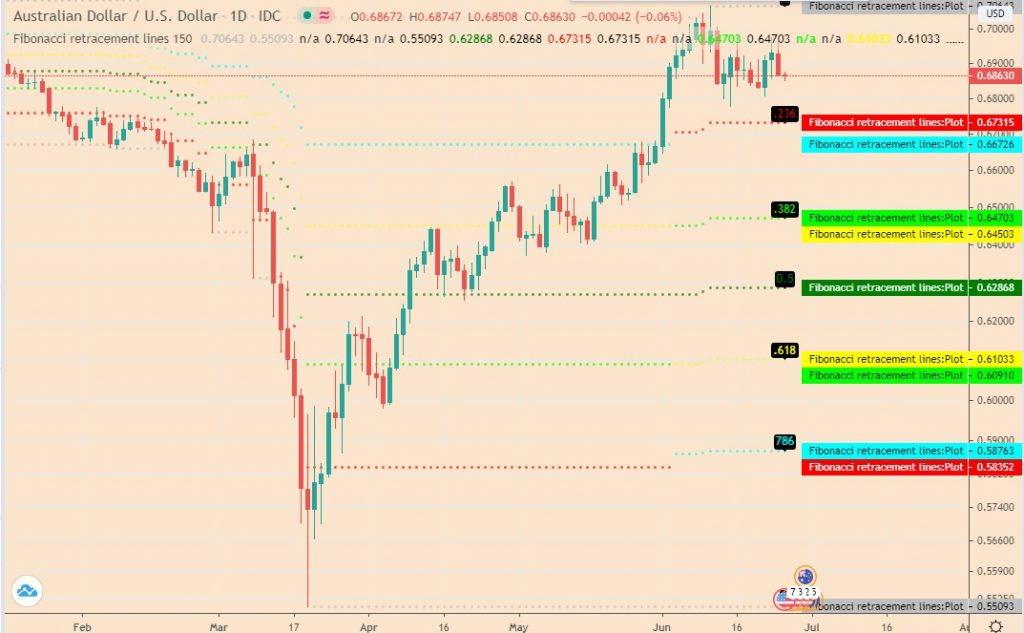
Leonardo Fibonacci is an Italian mathematician who introduces a series of numbers 0, 1, 1, 2, 3, 5, 8, 13, 21, 34, 55, 89, … etc. From this sequence of figures, it is found that the ratio that is most often found in every form of objects in nature, which is approximately a ratio of 1: 1,618 or 0.618: 1, better known as the Golden Ratio.
By using this ratio then applied in forex analysis and extends to other financial markets such as crypto and stocks.
Why is Fibonacci one of the leading indicators? Because Fibo levels, which are golden ratios, this Fibonacci is formed automatically when traders start drawing Fibonacci on their charts. Fibonacci retracement levels are then used as a reference in determining entry points.
Indeed a variety of ways to apply in trading, some use the Fibo 50 level as a bounce price reference for trading signals. There are also those who only use Fibonacci levels as a basis for support and resistance from price movements.
The use of Fibonacci also requires an understanding of candlestick patterns to determine whether there will be a trend reversal or continuation at the Fibo level. Some traders use Fibonacci extensions to determine profit targets.
Indicator setting
Fibonacci is actually included in the object list category in Mt4. This is one best leading indicators and you only need to draw Fibonacci lines by drawing a line from the top to the valley in the timeframe. It will automatically appear at the selected Fibo levels, you can add Fibo levels by modification.
Time frame
Fibonacci is widely used in H4, or H1 timeframes for swing trading and intraday trading.
Donchian channel
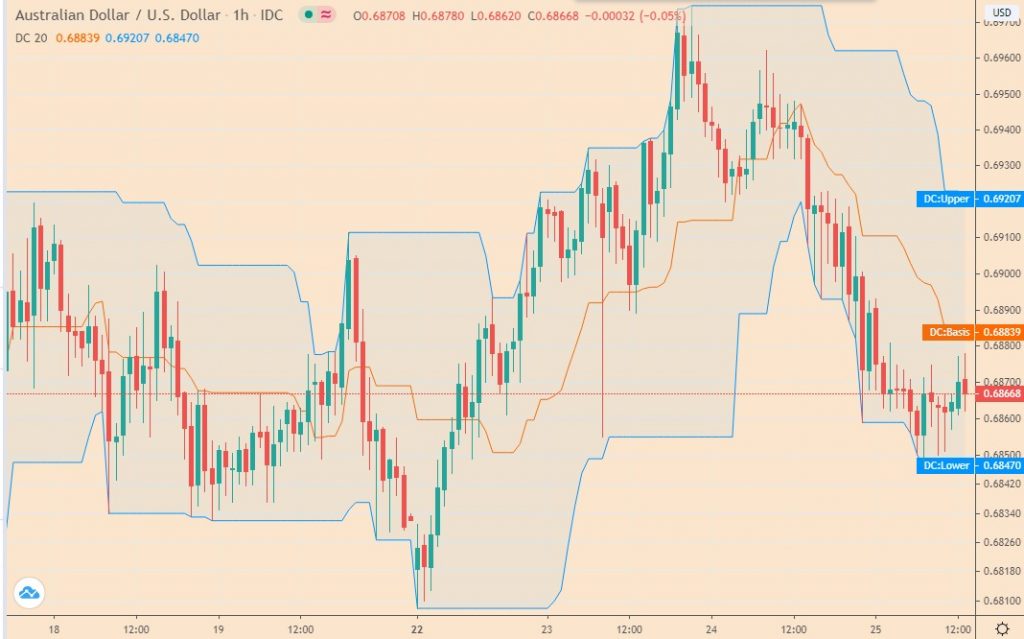
The next best forex leading indicator is the Donchian channel. Richard Donchian made this indicator around the 1960s. The basis for the calculation of this indicator uses the lowest and highest prices in the period of 20. This indicator is a leading indicator because it gives an early signal before a new trend is formed. Usually, this is for a strategy breakout by waiting for a breakout on the Donchian line as a reference.
The Donchian line consists of three curves, which appear similar to Bollinger bands but differ in the calculation. The top curve is the highest price of the last n value, and the bottom curve is the lowest price of the last n value. On the curve lines the reference breakout. as trigger entry new position trading.
Indicator setting
By default this indicator uses a period of 20 days, meaning this takes the highest and lowest prices in a period of 20 based on the forex market open for 20 days a month.
Time frame
It is recommended to use this indicator in the daily timeframe, to be more effective in providing the best signal. But you can test any timeframes.
Leading indicators examples trading
Although in general leading indicators to examine oversold and overbought, but also must pay attention to the momentum of the trend that occurs. For example, we use Stochastic, there prices have entered overbought and or oversold. But the trend is still going on, if forced into this condition, it will usually drag losses. Take a look image below as an example.
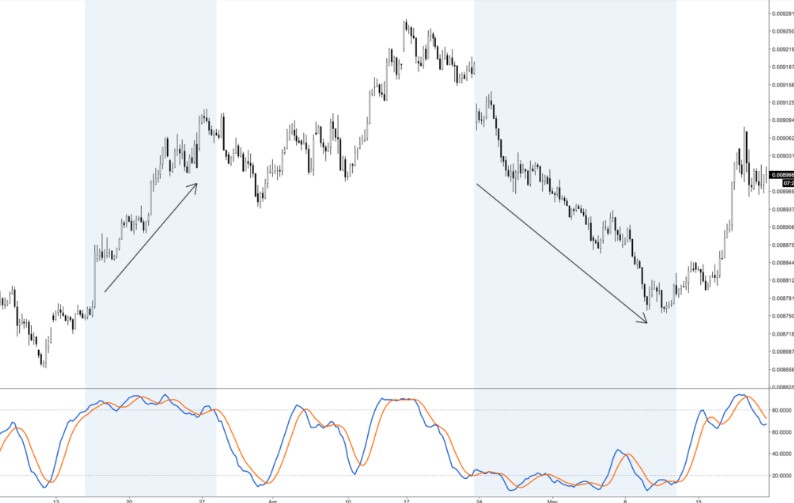
To leading indicators safety, It is better to wait for the stochastic line to fall below 80. So that it can be said that it is a reversal pattern after the momentum trend phase has ended. This will be an even lower risk when the trend momentum is still strong on the continuation of the trend.
As a combination, you can add other indicators that function as trend following so that it will be the best forex indicator combination. Like as with Moving average.
Final Thought
Beast forex Leading indicators do provide early signaling, but that does not mean they are flawless, prices often move dynamically, and therefore the application of indicators in trading must follow the rules of money management and risk management.
Because it is the key to all ways of trading forex, any indicator without money management will fail faster. And the quantity of transactions not guaranteed to provide more profit, this is wrong because the most important thing in trading is a high probability.
Even though you only make one order, but because you get the best price at the beginning of the trend, the profit will be maximal.
Are you ready to start trading?
Open an account or try Demo account.
You must read